Debugging QWeb using IPDB in Odoo can be a big help for developers working with the Odoo framework, particularly when dealing with complex templates and views. QWeb is Odoo's templating engine, and IPDB is a debugger that allows you to inspect and analyze your code during runtime. Here's a detailed description of how to debug QWeb using IPDB in Odoo
QWeb is Odoo's template engine used to render views and reports. It's based on XML and allows developers to design layouts, customize documents, and generate dynamic content. Debugging QWeb templates is essential when you encounter issues related to template rendering
Here's a step-by-step guide to getting started.
Step 1 : Install IPDB (or PDB)
pip3 install ipdb
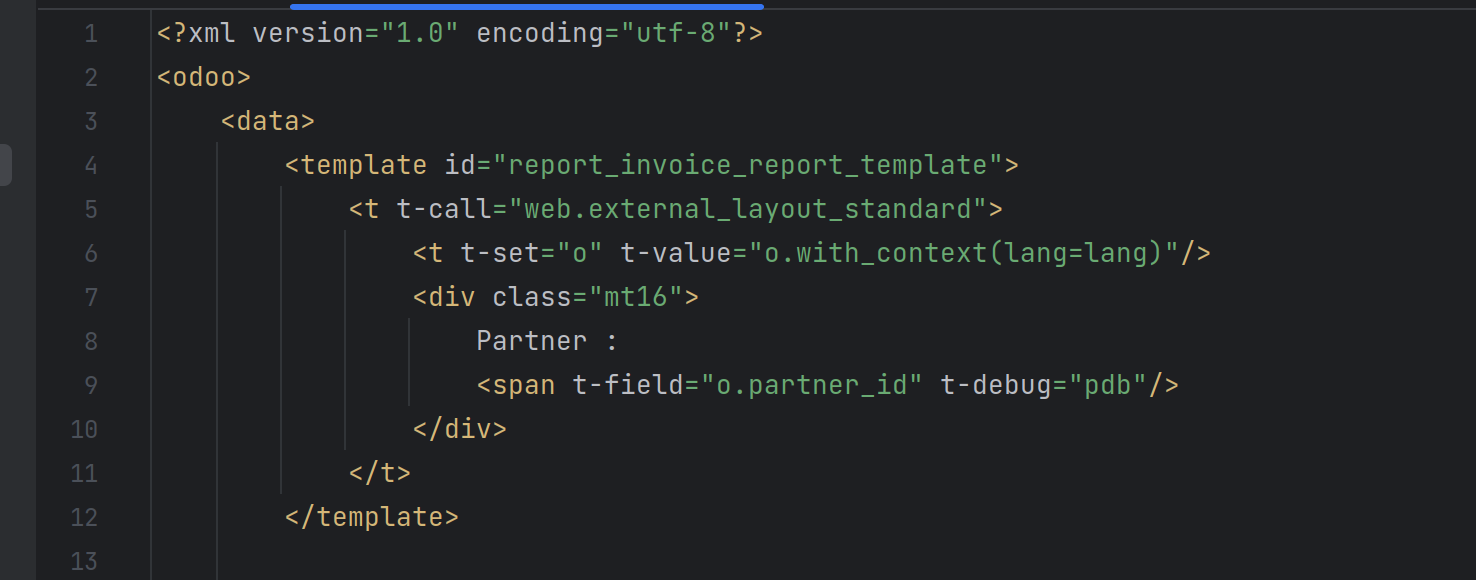
Step 2 : Add below code where you want to debug in xml
t-debug="ipdb" or t-debug="pdb"

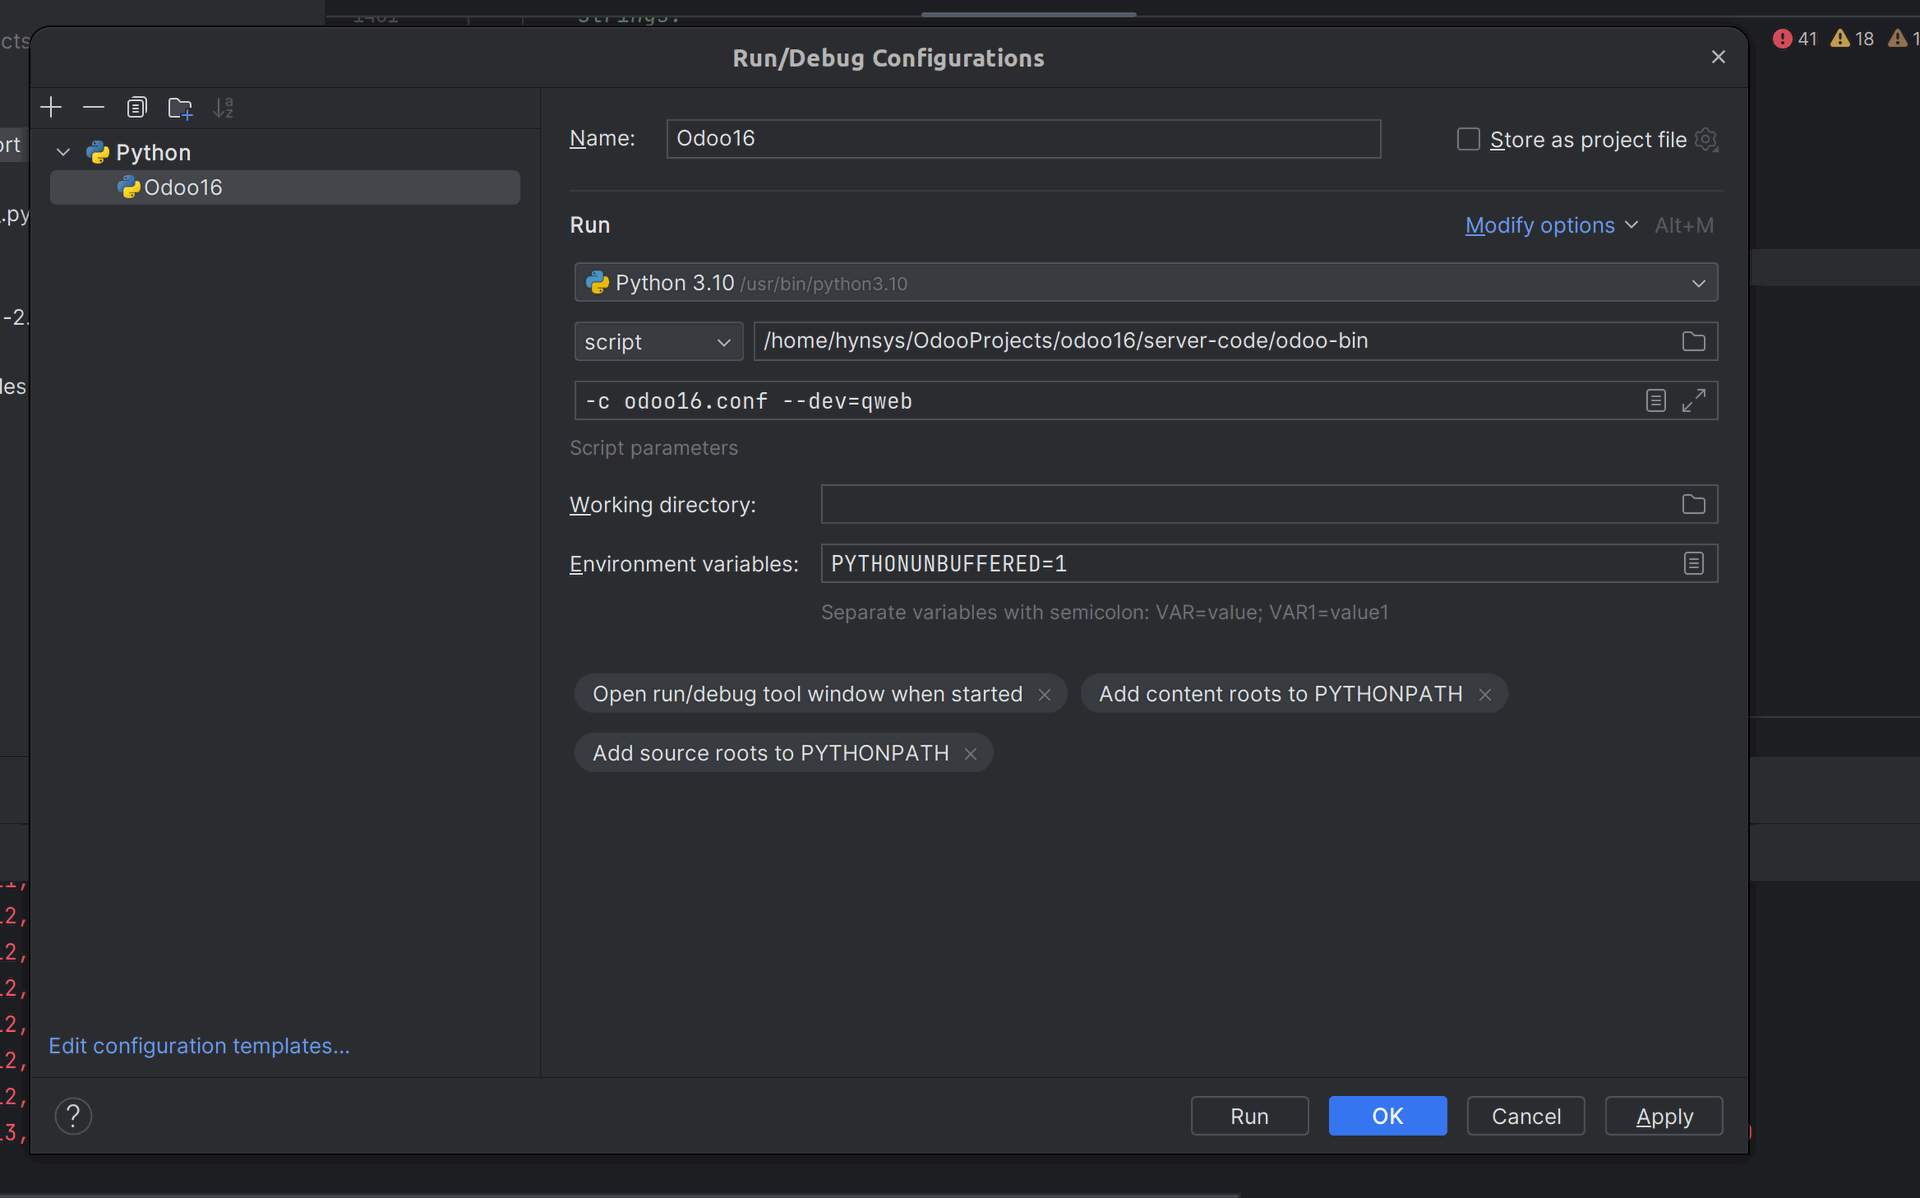
Step 3 : Make the following modifications to the Pycharm Debug Configuration
-c odoo.conf --dev=qweb

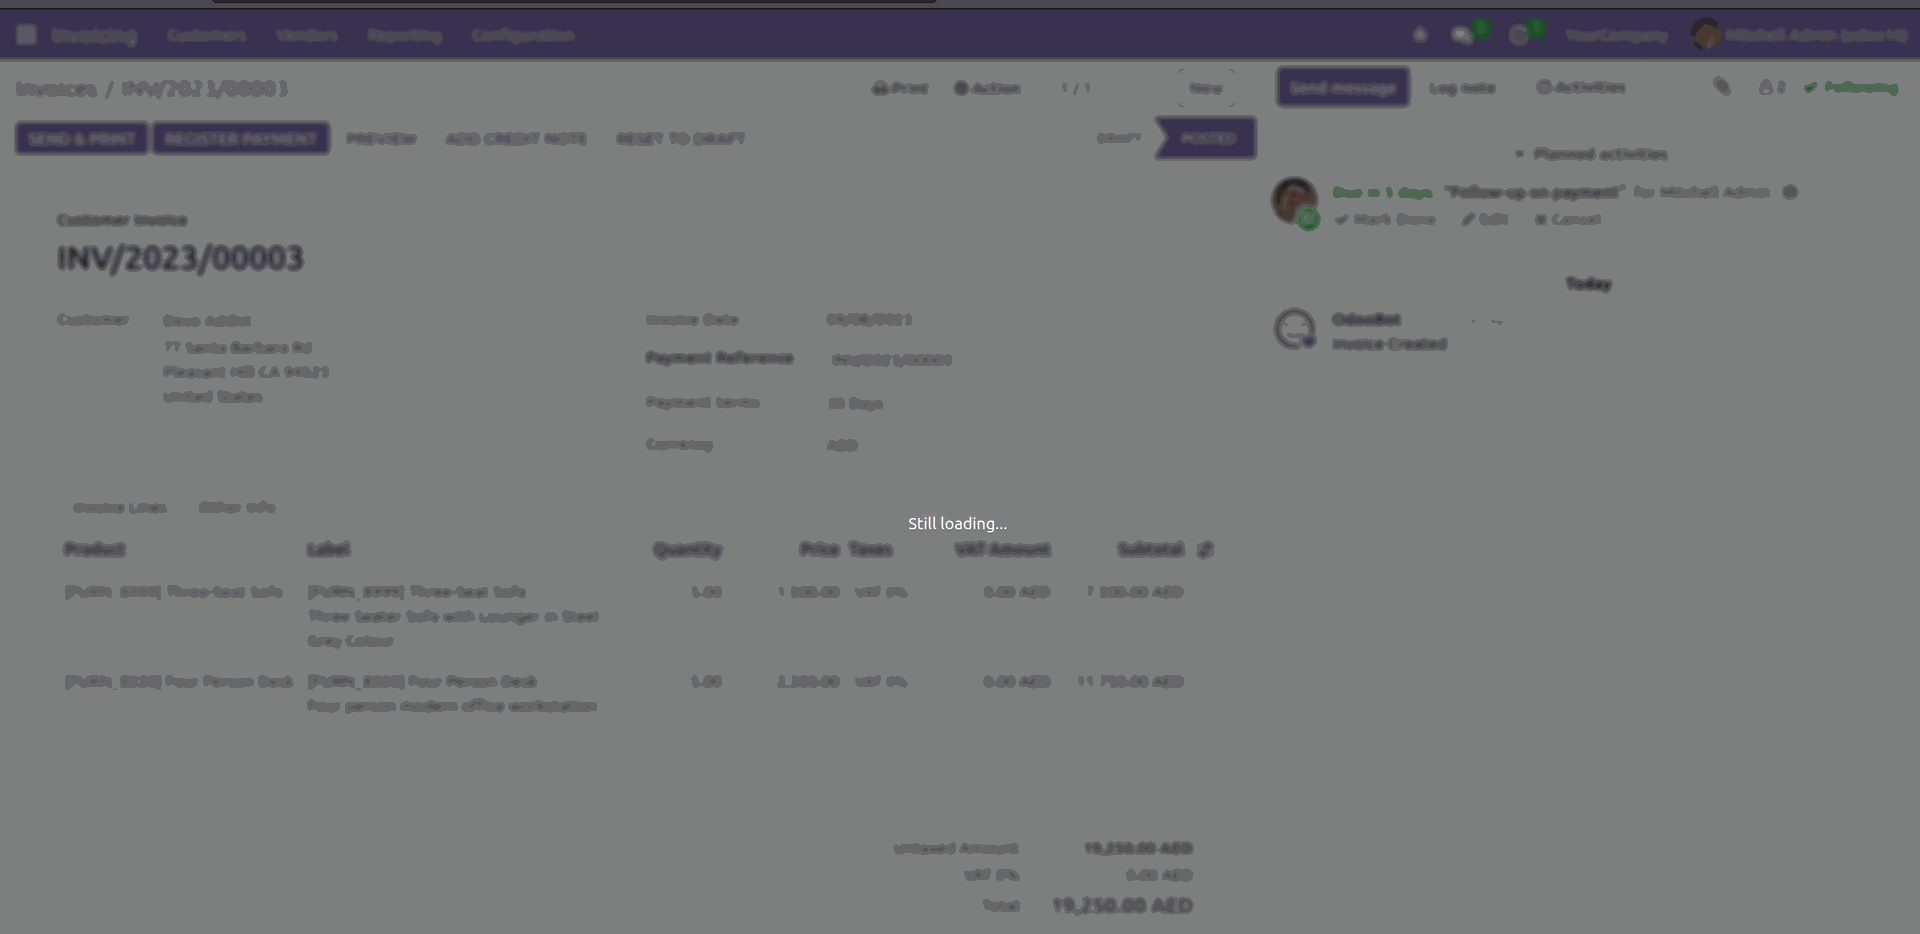
Step 4 : Generate the PDF print where you add t-debug tag to debug
The screen will appear to be loading as shown in the image below.

You can see that the debugging is available in the pycharm console

# for getting the values
locals()

By using the above method, we can easily debug various values in the QWeb. Please note that if you are using VS Code as your IDE, you might need to use integratedTerminal as your default console.